Case Study
1 Introduction
The last decade has seen a paradigm shift in computing infrastructure. Systems are becoming more and more ephemeral, abstracted, and distributed. Innovations in computing infrastructure and software architectures have yielded simpler components at higher levels of abstraction, but behind those simpler pieces lurk more complex systems. Engineers are able to deploy and stitch together many more different kinds of software components today, resulting in vastly increased complexity. As individual nodes in your system’s topology become more decentralized, they also become more complicated to track and monitor.
1.1 What is Dendro?
Dendro is an open-source, serverless monitoring framework for small, distributed apps. Our team built Dendro in order to help small teams handle the challenges of operating a distributed system.
Dendro enables you to collect, centralize, and store log and metric data emitted by the various disparate pieces of your system. With Dendro, when something goes down in production, there’s no race to SSH into a dozen different nodes to figure out what’s gone wrong; all of the log data you’d use for debugging has already been collected, processed and tagged with the servers and services that originated the individual records, and stored in a single database for querying.
All of this empowers the user to both greatly reduce costly downtime or outages, and proactively improve the overall performance of their systems. Prevention is important: you want to catch problems before your users do. If you’re constantly applying ad-hoc, band-aid fixes, you’re making your system more fragile instead of less.
To illustrate just exactly what Dendro does, let’s use the example of a small company named NapTime.
1.2 NapTime: An Example User Story
NapTime has two engineers, and they recently completed the beta build of their sleep monitoring app.
Their system itself has proven to be resilient so far, thanks to its small size and simplicity.
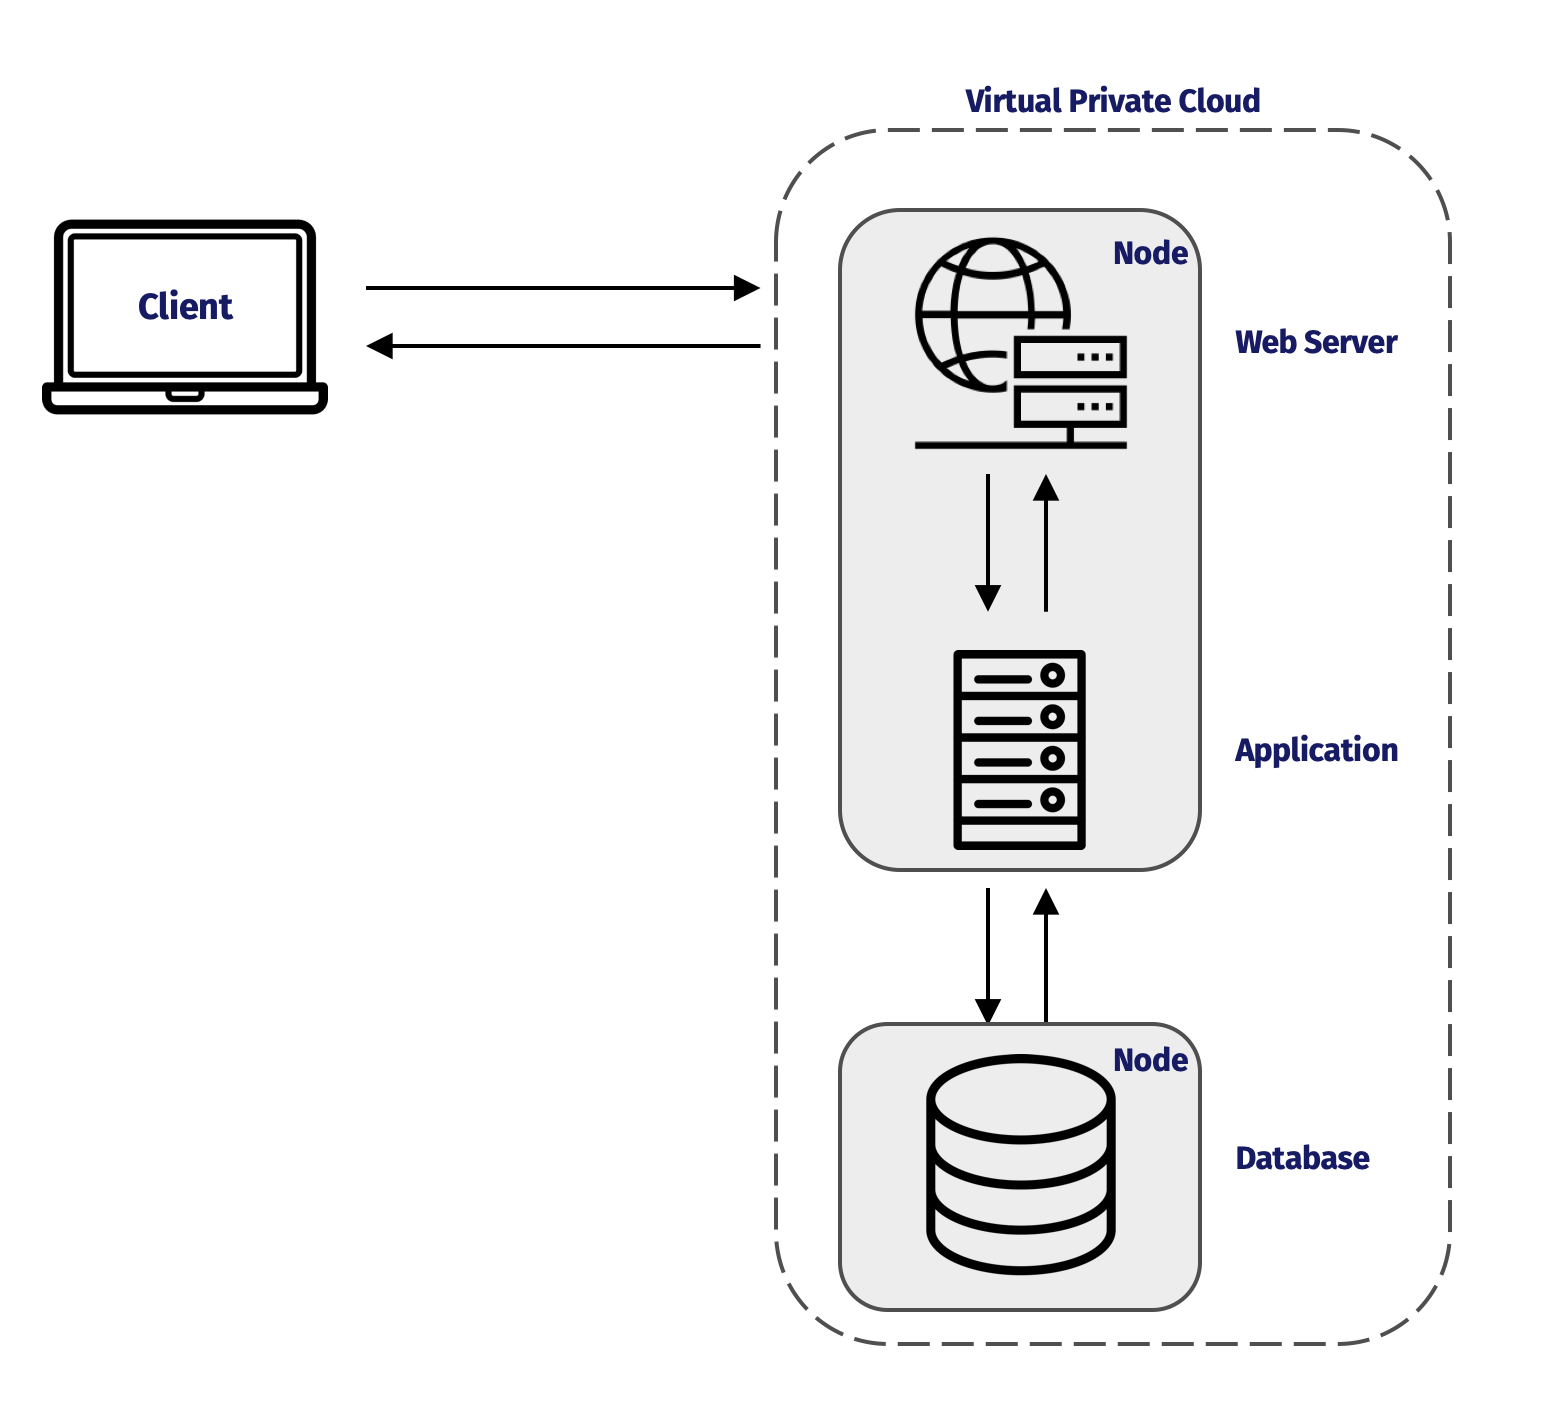
NapTime built a simple three-tier system in order to avoid premature optimization, with their web server and application running on one server, and their database on another.
The two engineers have been busy developing features and shipping their first few builds. When an outage or critical bug pops up, it derails their development flow. NapTime doesn’t currently have a monitoring solution in place, so they’re totally reliant on either hearing from users when something breaks, or coming across an issue themselves by poking around the system.
1.3 An Outage at NapTime
What happens when an outage is reported? Say, for example, a couple of users reach out to say that they’re trying to access their homepages but they’re just receiving a 500-level error.
The engineers decide on three priority debugging steps: ensure that each server in their system is up, ensure that each of the services running on those servers is up, and check whether those services are sending and receiving requests and responses successfully.
First, if they have a list of their static IP addresses, they can use the Unix command line utility `ping` to check whether each of the servers is up at all. If the servers are up, it’ll be useful to see their health metrics. NapTime engineers might run a utility like `top` on each of the servers to see a summary of the system’s health (e.g. overall CPU load or available memory) as well as what processes are running on the server.
If everything checks out with the system’s health, it’s time to start looking into the individual services running on each server. If the engineers are interested in a running process, like an application, they might check the status of their process manager. Each service generally has a different method of checking its health.
After the most obvious checks (e.g. is something even running?) come the next steps. What if none of their checks turn up an issue? Performing each of the aforementioned steps manually will tell them how something is performing at the moment of observation, but what about performance just before they checked? Or how about at the time the complaints started coming in? The log files that each of NapTime’s servers and services produce can provide the answers to these questions.
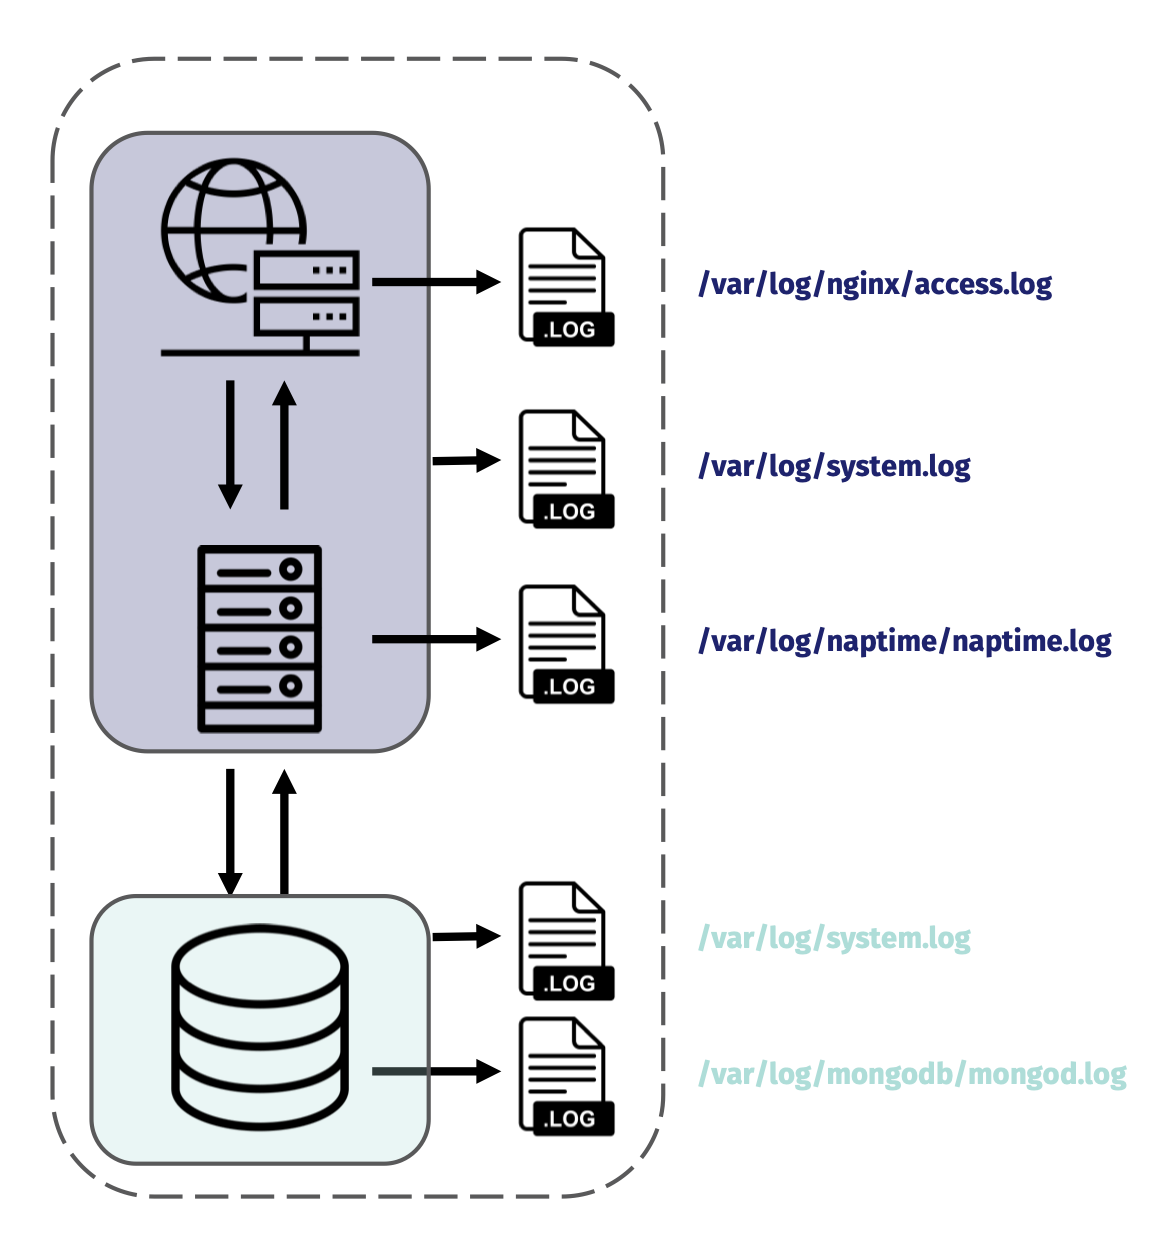
Let’s say that the NapTime team is curious about what’s going on with their Nginx web server. One of their next steps would be to take a look at the access log file in the nginx subdirectory of var/log.
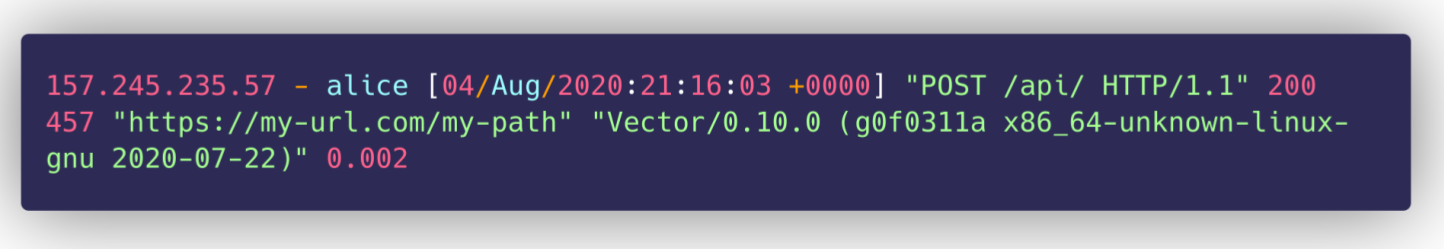
Web servers like nginx and Apache produce access logs, where each line contains information about each request sent to the system; like the IP address of the requester, time of the request, the path of the requested file, the server response code, the time it took the server to fulfill the request, and more. If there are 500-level errors occurring, exploring the access log of their web server is where NapTime would find evidence of them.
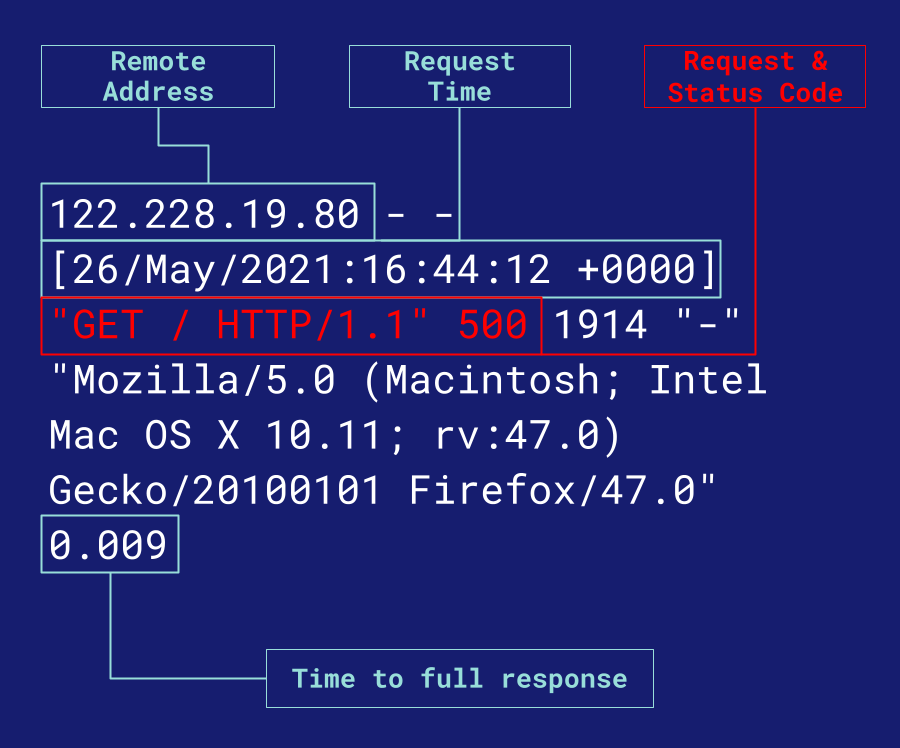
The individual log lines NapTime would find would look something like the above diagram. An interested engineer can take logs like these and analyze them, either one by one or aggregated, in order to achieve a number of insights, like: · Finding individual specific events in the past · Graphing trends over time, like 500 response codes or aggregated requests per minute · And alerting specific users when pre-defined heuristic thresholds are met or surpassed
1.4 Scaling up NapTime
Let’s consider NapTime’s architecture and processes after they scale a bit more. They still have a three-tier architecture, with presentation, business logic, and storage abstracted away from each other, but now they have more overall servers and services.
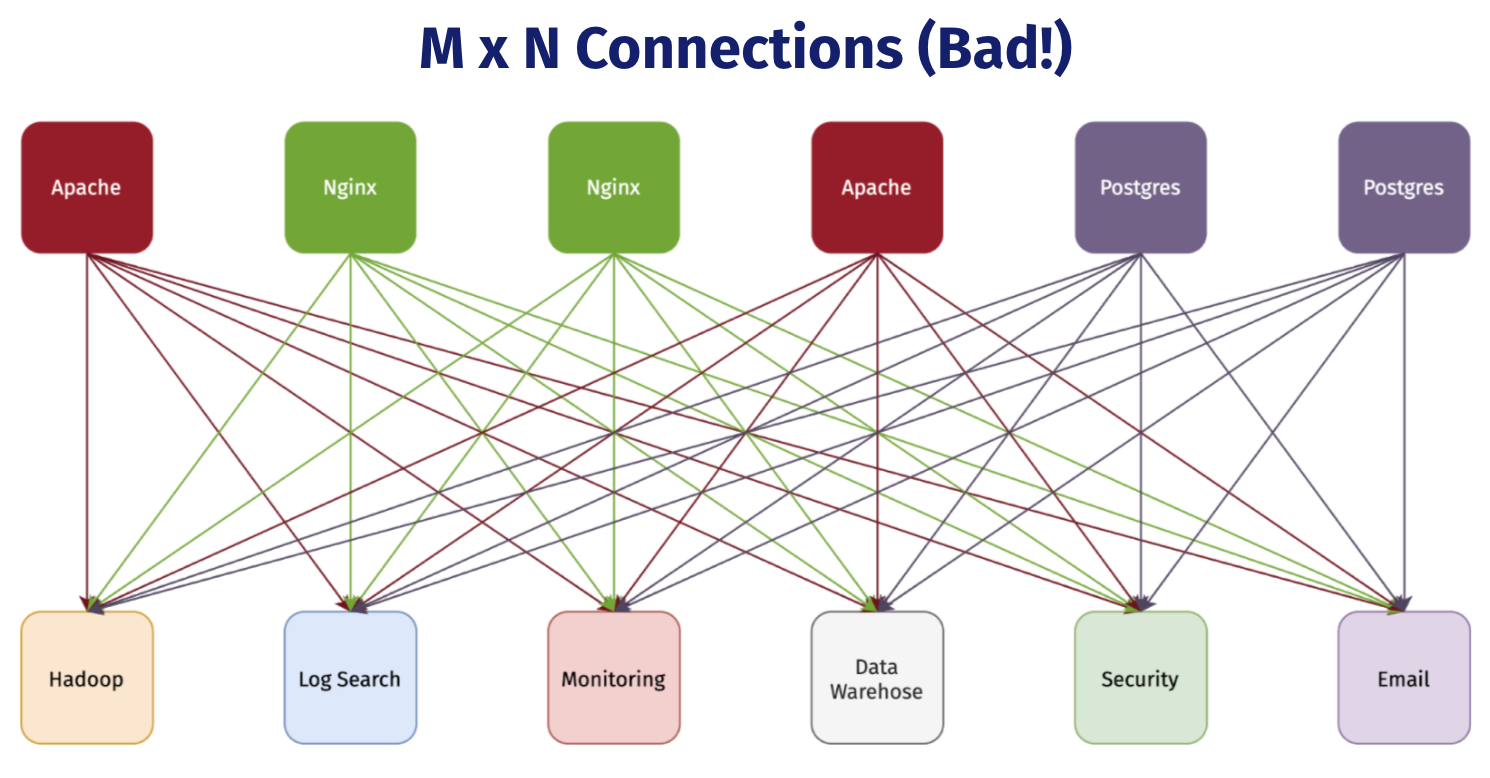
Collecting and processing logs is straightforward when everything is on a single machine, you just use some software to handle aggregation. But when you have a distributed system with multiple nodes, instead of just software you need both software AND some infrastructure that can handle both transportation to and storage in a new central location.
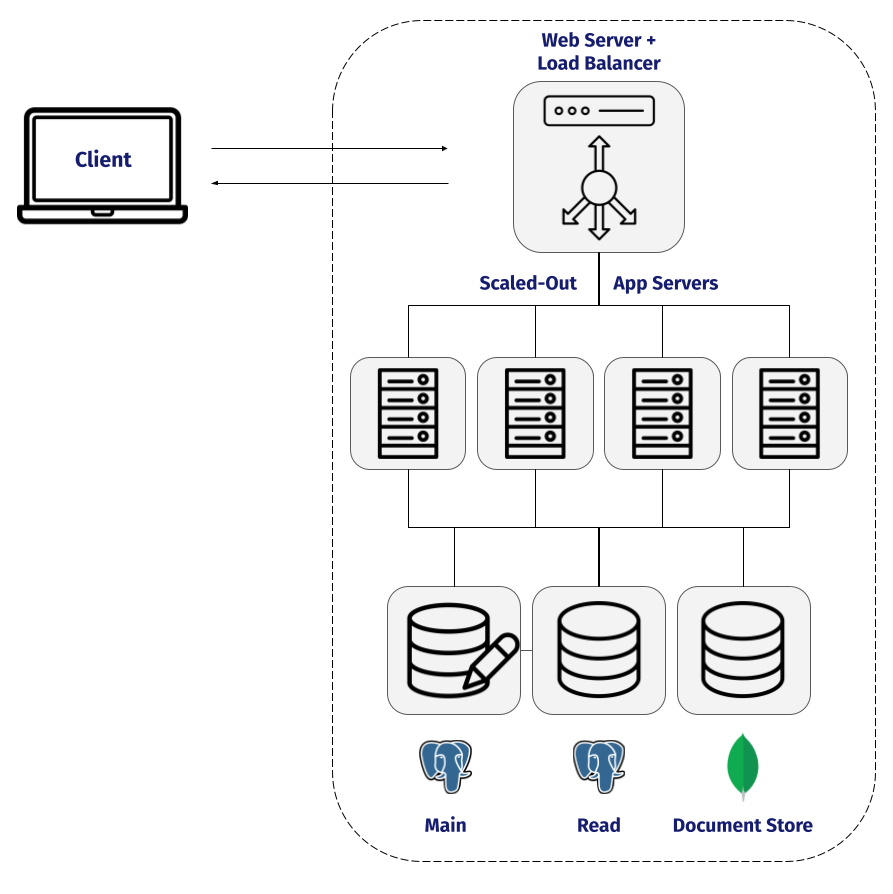
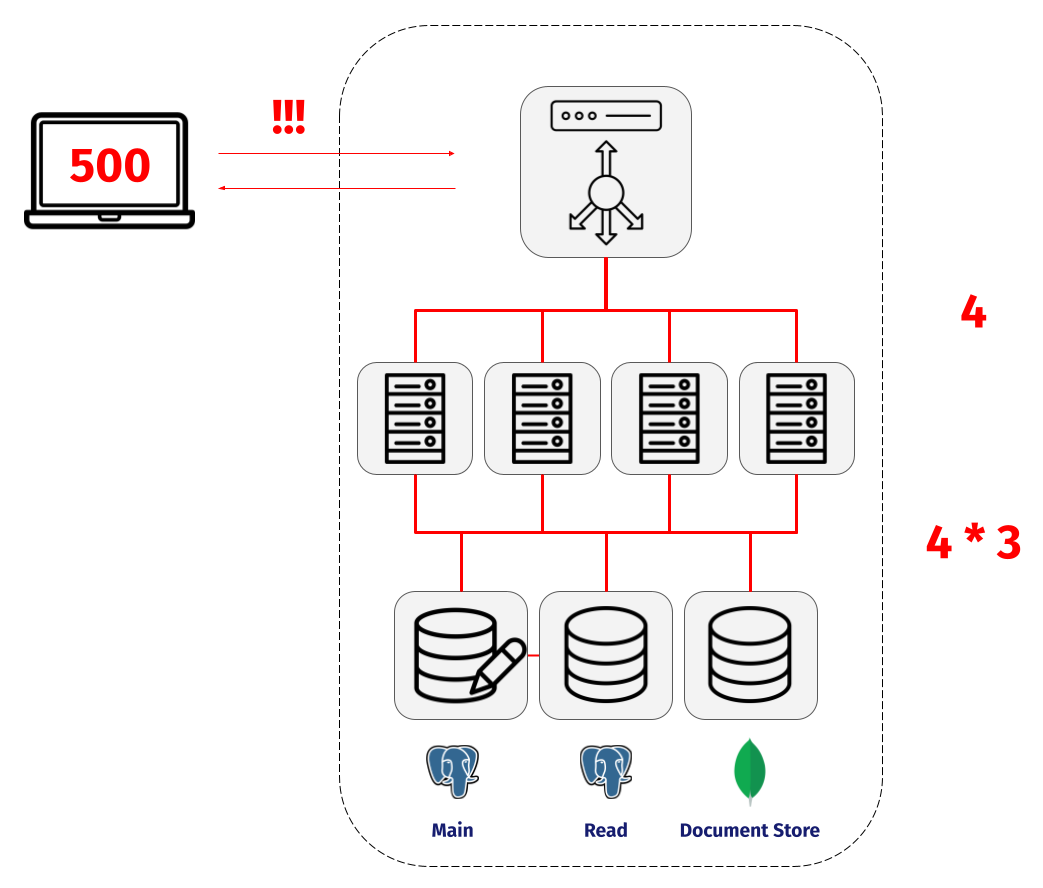
Suddenly NapTime is in charge of 8 nodes instead of 2, scaled out app servers, more unique services, a load balancer, and multiple databases. What is debugging like for them now? What if MongoDB suddenly stops responding, or one of the app servers can no longer write to the Main Postgres instance? How will NapTime isolate what went wrong, let alone actually fix it? Their number of servers and services keeps growing, and the number of connections between all of them continues to grow exponentially. How is the team supposed to get a holistic understanding of what’s happening across the entire topology of their system?
Monitoring is toil. That is, if you don’t have an automated framework taking care of it for you. As detailed above, one key component in “monitoring” is examining the log output of your systems. That can mean reading through files thousands of lines long, like NapTime’s Nginx Access Log, one line at a time. No one wants to read log files line by line if it can be avoided. After all, one of the main motivations of the field of software engineering is automating the toil out of processes.
On Unix-like systems, a common strategy to gain a quick insight into what’s happening with a service is to run the command `tail -f` on the log file to which that service writes. Tail prints the last 10 lines of a given file to STDOUT, and the `-f` flag indicates that the program should continue to “follow”, streaming new lines to STDOUT as they are written to the file.
This process worked fine for NapTime when they wanted to watch the real time stream of log messages on one machine or two. But what about now that their system is distributed across nearly a dozen servers? Are their engineers going to open a dozen terminal windows and SSH onto each individual server?
Monitoring distributed applications is exponentially harder. The Naptime engineers simply wouldn’t be able to watch and comprehend the stream of logs coming in for every service on each server in real time. They would want to be able to capture those logs as they’re written or emitted and save them for later. Ideally on a central server of some kind, so they don’t have to go SSHing around to find what they need in the stress of an outage.
1.5 Observability
The visibility that a team like NapTime seeks into their system is summed up by the concept of observability.
Due to the nature of software, no complex system is ever healthy.
Distributed systems in particular are pathologically unpredictable. When multiple services in a distributed system are communicating with each other over the wire, each hosted on a potentially ephemeral node, the possible failure conditions are nearly endless. What if a server is down? What if a service is down? What if both services are up but are failing to communicate for some reason? Et cetera.
In light of these challenges, a team must also keep in mind to design their systems to facilitate debugging.. Things will break and outages will occur. Hope is not a strategy; but preparedness is.
1.6 Need for a monitoring strategy
Things can get messy very quickly. Without a centralized platform for handling the collection, transportation, and storage of your data, those valuable records can get lost or never collected in the first place. Developing a strategy for the collection, centralization, and retention of your log and metric data means that you don’t prematurely forfeit the benefits that logs and metrics provide.
Dendro acts as that strategy.
A team can SSH into each of the nodes in their system, configure and deploy a logging pipeline using Dendro’s cli tool, , and start shipping all of their log and metric data off of their servers and onto a central store. The logs and metrics produced can come either from services running on the server, like nginx or Postgres, or from the server itself, in the form of host metrics like CPU load or available memory.
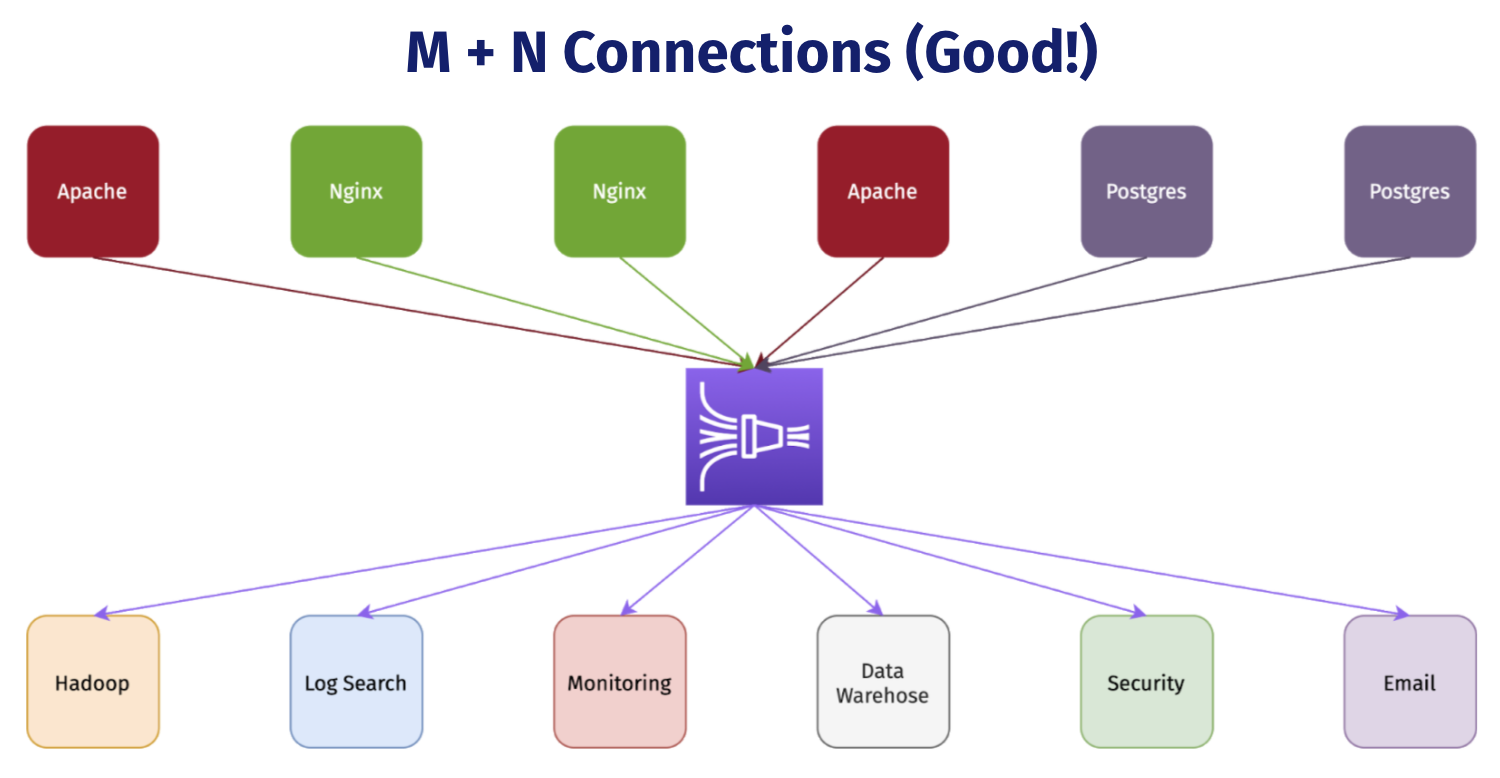
Dendro provides a single, centralized log management solution, untangling the web of data producers and consumers. No more routing logs from individual sources to multiple destinations over time. No more custom aggregation scripts, cron jobs, or any of that. Dendro collects the logs and metrics emitted from distributed servers and services over time, building a single source of historical state.
That single source of truth about system and service state and performance empowers the user to: · Ensure that all output or generated data is reliably and automatically captured, without having to do it manually · Avoid context switching, or jumping between databases and machines trying to dig up whatever went wrong · And reduce debugging time, because everything exists in a single database and can be queried and explored like normal relational data.
Each of these benefits brings the user closer to the holy grail for engineers: automating away manual toil.
2 Overview of Dendro
2.1 How does Dendro help teams?
To explore exactly how Dendro empowers small teams working on distributed applications, let’s think back to the example of NapTime after they’ve scaled their architecture.
Dendro includes a collection agent that the team installs on each node in their system. That collection agent gathers log and metric data from both the services running on the server, as well as information about the server itself.
But how does the data make the jump from those machines to the central database? That would require an infrastructure pipeline, in addition to the deployment of some type of collection software.
2.2 What’s in Dendro?
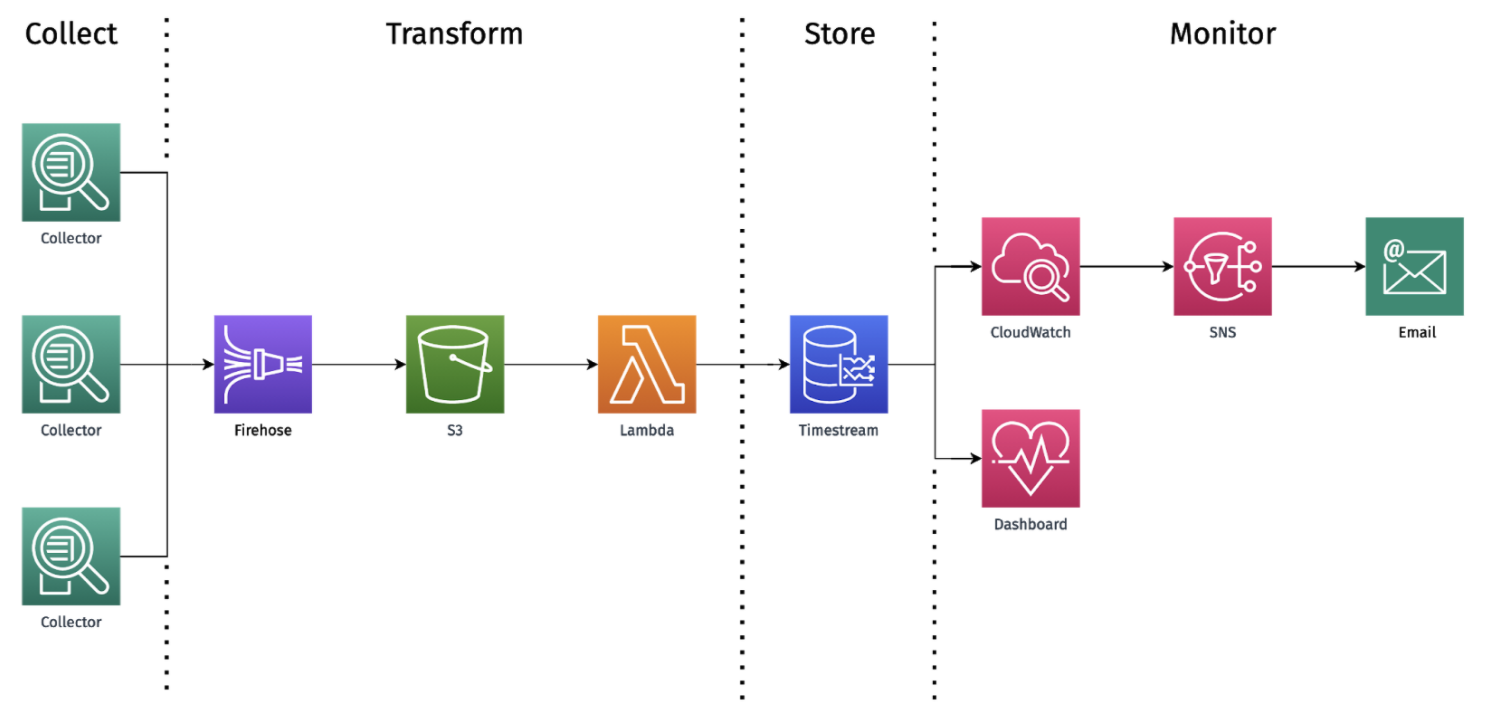
This is an overview of Dendro’s architecture and the infrastructure behind this framework. We’ll dive into it in more detail later, but for now let’s stick to the main conceptual pieces.
We’ve already discussed how Dendro helps you set up the automated collection of logs and metrics from your services. You don’t need to change a single line of your application code-- Dendro runs as a fully-decoupled agent process on your nodes, tapping into the log files to which your services already write and scraping metrics from the server. But collecting your logs and metrics is only the tip of the iceberg.
The collection agent streams data at the time of generation to your own pipeline that Dendro creates. Getting the data off of the machine as quickly as possible is important for both your ability to monitor in real-time, as well as ensuring that data isn’t lost if an ephemeral virtual machine gets spun down outside of your control.
The pipeline also features a processing step where the collectors deployed by Dendro take the raw data coming off of your servers and rework it into predictable, structured output, before storing it in a time-series database optimized for writing, processing, and querying time-series data. Dendro builds a single source of truth for you with each table representing a different capture source, while preserving the identity of the host machine or process for each row of data.
All of your monitoring data existing in the same place (your Timestream database) allows you to keep context switching at an absolute minimum while debugging, while also maintaining high-resolution in your data so you can visualize and explore granular changes in the performance and state of your servers and services over time.
2.3 Why did we build Dendro?
The goal we had in mind when we set out to build Dendro was to help teams start collecting, centralizing, storing, and getting value out of their logs and metrics today, so they have them when they need them.
3 Who should use Dendro?
When it comes to picking a monitoring solution, companies generally consider three options: buy, operate, or build.
If a small company like NapTime was to buy a solution, they might look at working with a SaaS vendor like Datadog. Outsourcing your monitoring to a vendor makes the whole process very easy and painless, but that ease comes with a pretty steep price. Not every small company has enough runway to justify spending money on yet another SaaS service.
The next option then is to operate. Open source platforms like Elastic were developed to make this relatively simple. However, if you want to use the open source Elastic Stack, you’re still responsible for hosting all of it, and managing an Elasticsearch server requires knowledge of Java and prolonged attention. What if NapTime’s engineers don’t have that expertise or time?
The third option, build, simply isn’t feasible for a small company. If you’re a tech giant like Facebook or Twitter, with a huge budget and plenty of infrastructure, you can roll your own observability platform. For a small company, their time is much better spent on their own core-business product that keeps the lights on.
But what if there were another option? That’s where we think Dendro fits in.
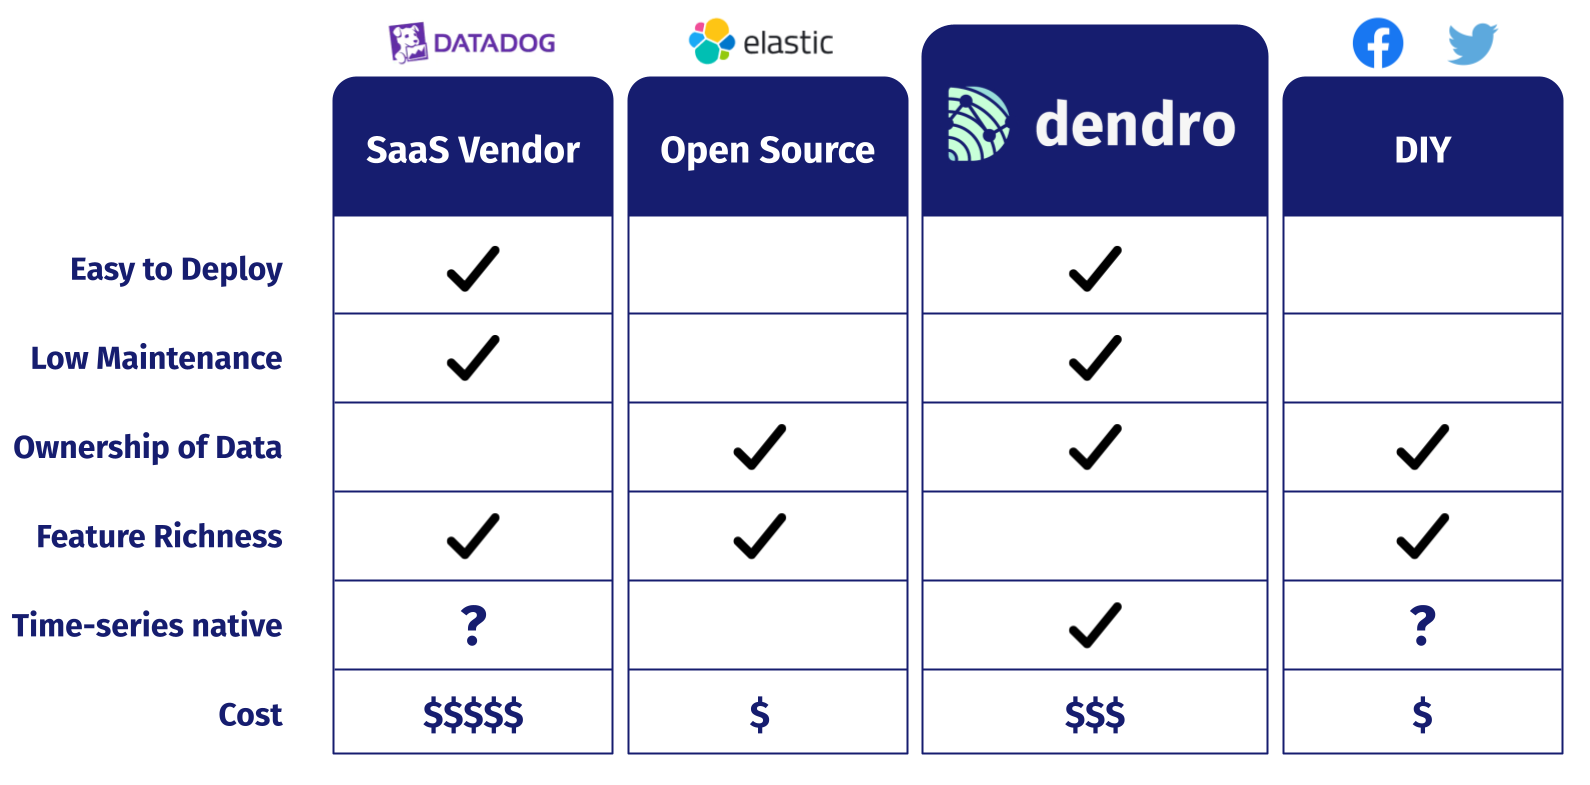
Dendro combines the ease of deployment and low maintenance of a SaaS solution thanks to its collection agents and fully-serverless pipeline.
Dendro mirrors the ownership of data promised by Open Source or DIY solutions. Log data can be extremely sensitive, and you don’t necessarily want someone else having access to your records in their god view/admin platform.
However, Dendro isn’t nearly as feature rich as any of the other solutions. We built Dendro with a specific, niche use-case in mind and can’t come close to offering the richness of a Datadog, Elastic Stack, or highly custom DIY platform.
One of Dendro’s main differentiators is that Dendro treats time-series data as a first-class citizen. The time-series database in Dendro’s pipeline is optimized for inserting and indexing time-based data, and comes with a whole slew of time-series query and aggregation functionality that Elasticsearch does not support.
But, what we traded for the ease and speed of setup and time-series optimization is cost. We designed the pipeline using AWS components, and while their pricing can be opaque and tricky to calculate at times Dendro certainly costs more to keep running than the Elastic Stack or a DIY platform because you’re not operating the platform on your own infrastructure.
4 Design Decisions
Our primary goal while designing Dendro was to help teams start collecting, centralizing, storing, and getting value out of their logs and metrics as soon as possible. That way, teams have their monitoring data already saved and explorable when they need it the most: in the stress of an outage. Our team took that goal and broke it up into three components: The need for a “low-toil framework” Treating time-series data as a first class citizen Decreasing Mean Time to Resolve (MTTR)
4.1 Low-toil
A low-toil framework is one that is easy to set up and maintain, helping your core development flow without adding to your busy workload. There are 3 factors the team decided were crucial to determining whether a framework could be called “low-toil”:
Ease of Integration
To start aggregating logs and scraping metrics, users generally need to deploy a collection tool onto their servers. Ideally, such a tool should be able to collect, transform and route all monitoring data. Moreover, it should be able to configure monitoring for multiple services without requiring users to write custom integration code.
A ready-made pipeline
A low-toil framework should provision and deploy a pre-designed/opinionated logging pipeline for users, freeing them from the need to research and construct their own -- enabling them to focus on their core functionality.
Low maintenance
Provisioning and maintaining servers takes time and can be difficult. And even under close observation, they can still crash at seemingly random times. The ideal low-toil framework would feature a pipeline that is completely serverless to avoid extra stress and overhead for development teams.
Every service in Dendro’s pipeline is fully serverless and managed for you by AWS. Users don’t need to worry about Dendro crashing or becoming bogged down during peak loads.
4.2 Time-series native
Time series data is a collection of observations obtained through repeated measurements over time. Think of a graph that has time as the x-axis-- that’s time-series data. At the level of a single record, time-series data is indistinguishable from normal relational data that features a timestamp as a field.
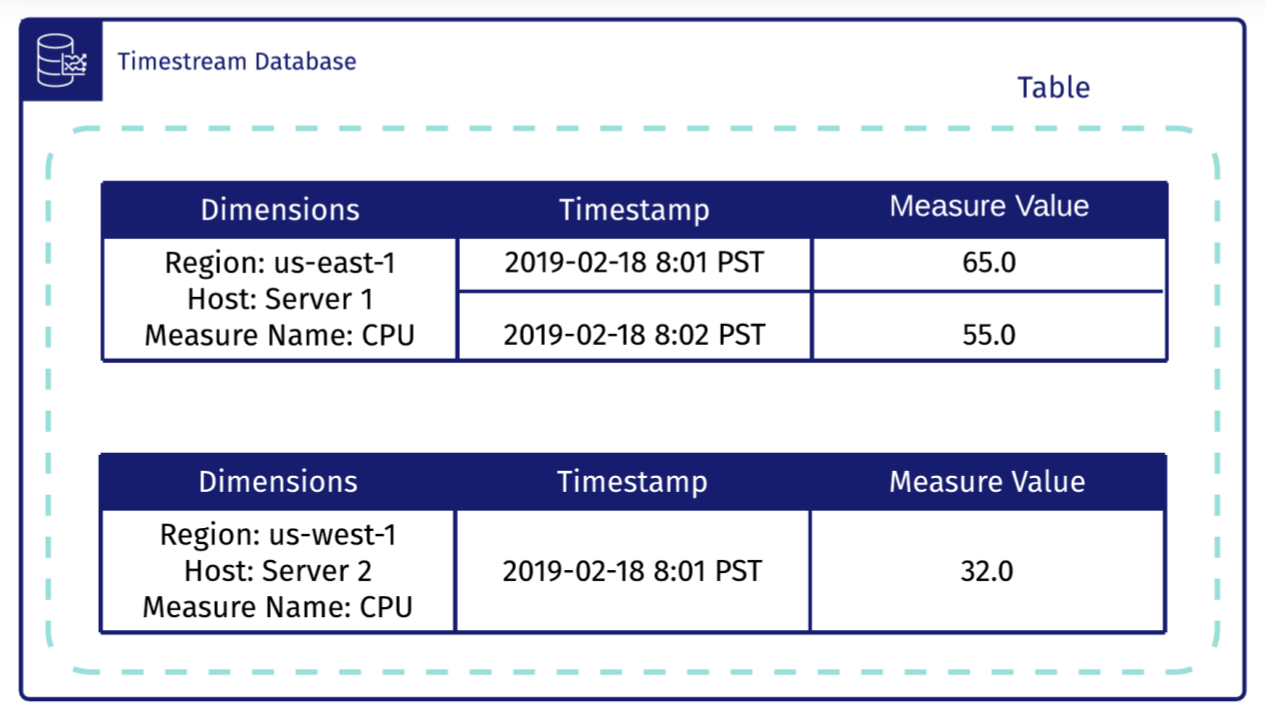
With that in mind, log data is perfectly suited to being treated as time-series data. For example, time series data could measure the average response time of a web server over the course of a week. The distinction between normal relational data and time-series data is more meaningful when one thinks about aggregating and querying data at the database level.
Elasticsearch & other such stores/services are optimized for text-based indexing and querying, but are not optimized for time, and so typical queries you’d want to perform with time-based data are either slow or not possible to perform.
Mapping logs from plain-text log lines to time-series records in a database unlocks a large range of time-specific querying functionality that helps Dendro improve your ability to extract insights from your logs over time.
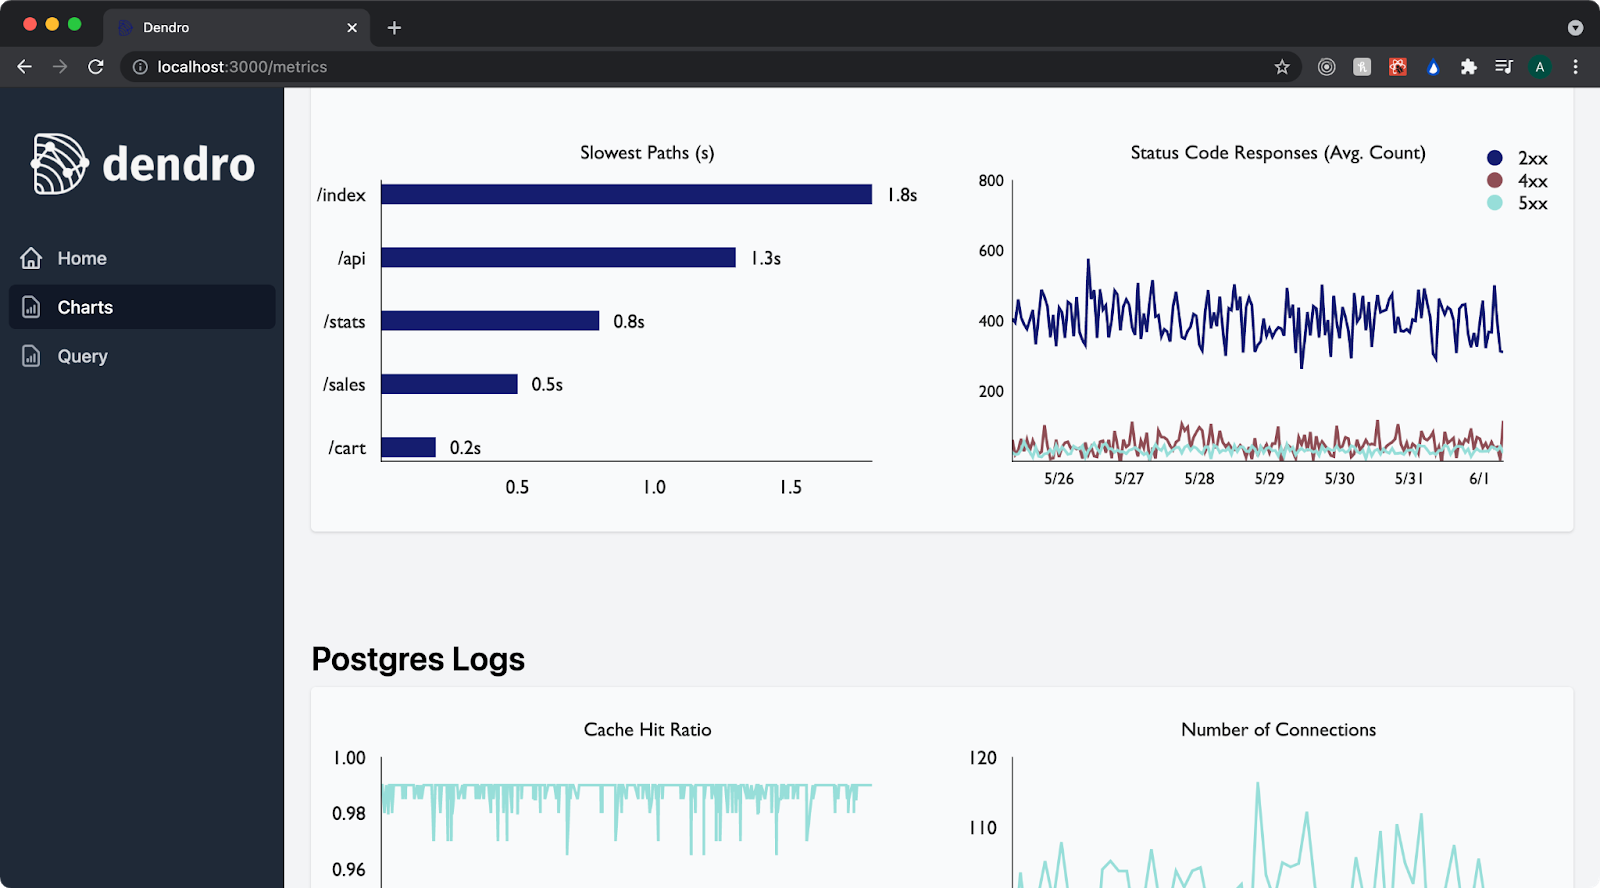
If we look at a web server such as Apache or nginx, we can think of a few important metrics that use time as a measurement. 1. Request time duration - “What happened yesterday that caused our average request time to double?” 2. Request status codes - “What happened at 4pm that started causing 500 status codes?” 3. Requests per second - “When are our slowest hours so the team can schedule maintenance?”
4.3 Decrease Mean Time to Resolve (MTTR)
Getting insights into distributed systems is cumbersome.
For example, think back to NapTime’s scaled architecture. Their system includes 8 different nodes and 16 different network connections that could fail. If some error occurs, where did it happen? What node failed? What logs do they check? Without log aggregation and centralization, NapTime would have to check each node individually.
Dendro aims to decrease the time between an outage occurring and the time it takes for you to resolve it. We don’t want your outages to be a murder mystery. And we don’t want you or your team being reactive.
Instead, we want you to be proactive. Dendro not only helps you catch issues early, but also informs you in real-time precisely what’s broken, helping you pinpoint exactly what went wrong and on which node. Dendro does so by monitoring incoming logs and metrics to notify users of failures, thereby decreasing the time it takes for your team to become aware of a problem.
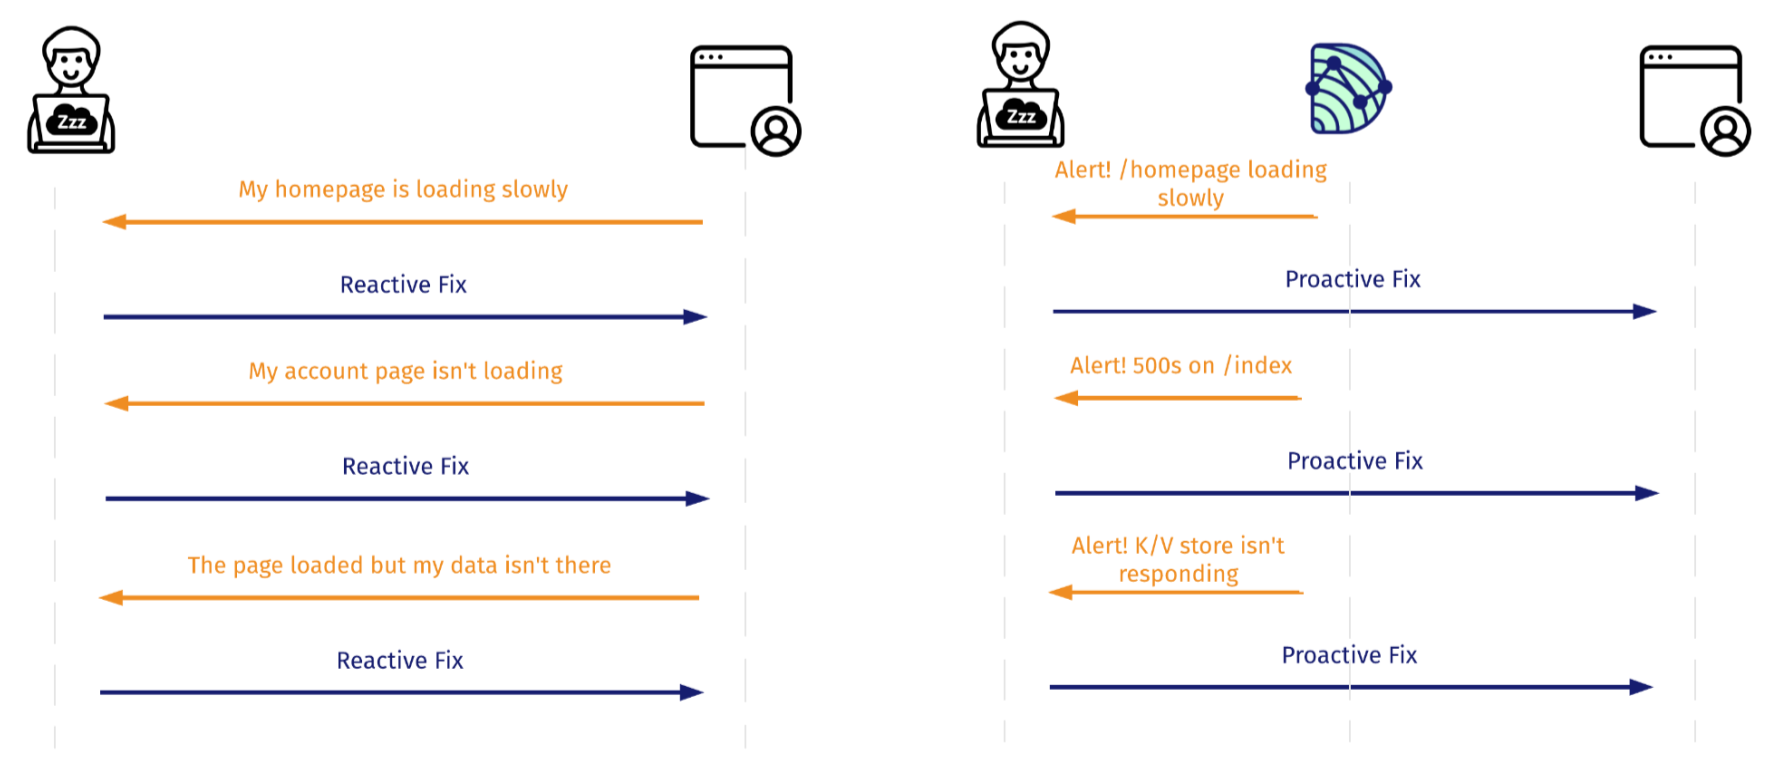
With Dendro, NapTime’s engineer’s no longer need to check 8 different nodes. By aggregating logs into a single database and providing a dashboard to query and view health metrics, Dendro helps solve outages efficiently without your engineers having to play detective.
5 Dendro's Architecture
We’ve seen how Dendro’s architecture is split up into four major conceptual sections. In this next section we’re going to more closely examine these pieces as well as the individual components that comprise them.
5.1 Collection
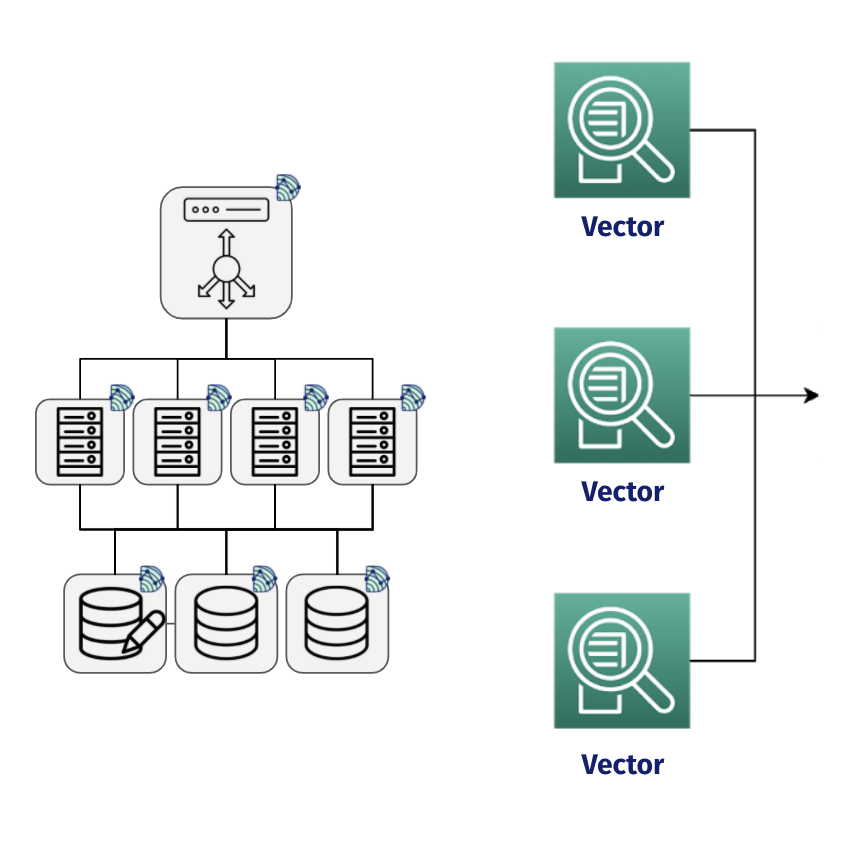
For each service in a user’s distributed app that they want to monitor, they need to set up collection. Dendro uses a collection agent called Vector to gather, transform, and send a user’s distributed logs to the pipeline.
Raw logs are text based, unqueryable and generally hard to work with. Vector makes it possible to take this raw, plaintext nginx access log and convert it to JSON prior to sending the log off to the pipeline for further processing.
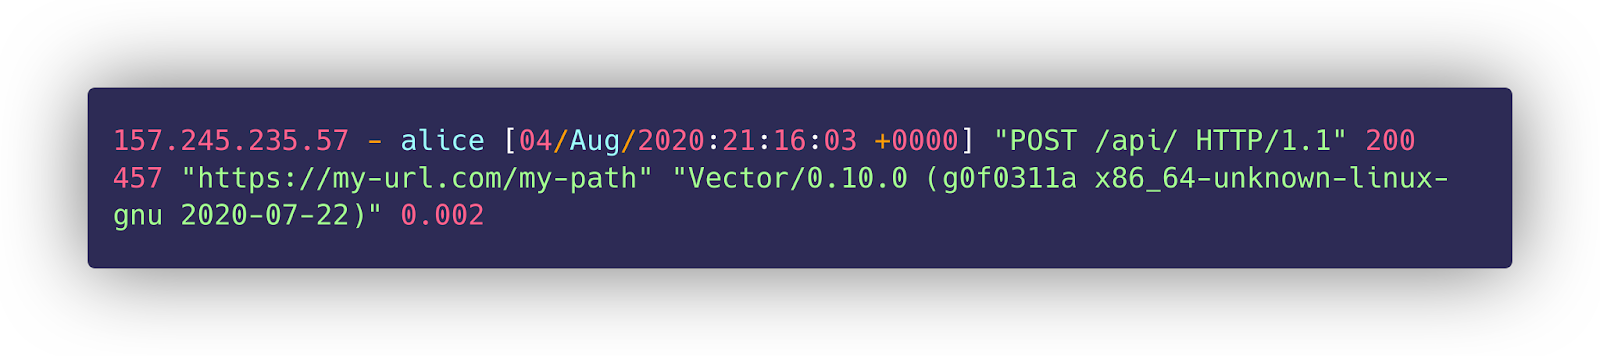
Looking at this log, we can see several important pieces of information. The path that was requested, the amount of time it took to complete the request, as well as the time the event occurred. Dendro needs to somehow identify and capture this information from this dynamic log.
To properly function on each node it’s deployed on, Vector requires a lengthy configuration file. It includes all of the log and metric sources you want to gather from and the sinks you’re sending to. It requires writing esoteric regexes to transform those logs from plaintext to a structured format, and configuring your AWS credentials to ship to the pipeline. Dendro adds a “type” field to each collected record, identifying the service that produced the log. This type property is crucial for a sorting step that occurs later on in the pipeline and which we’ll discuss below.
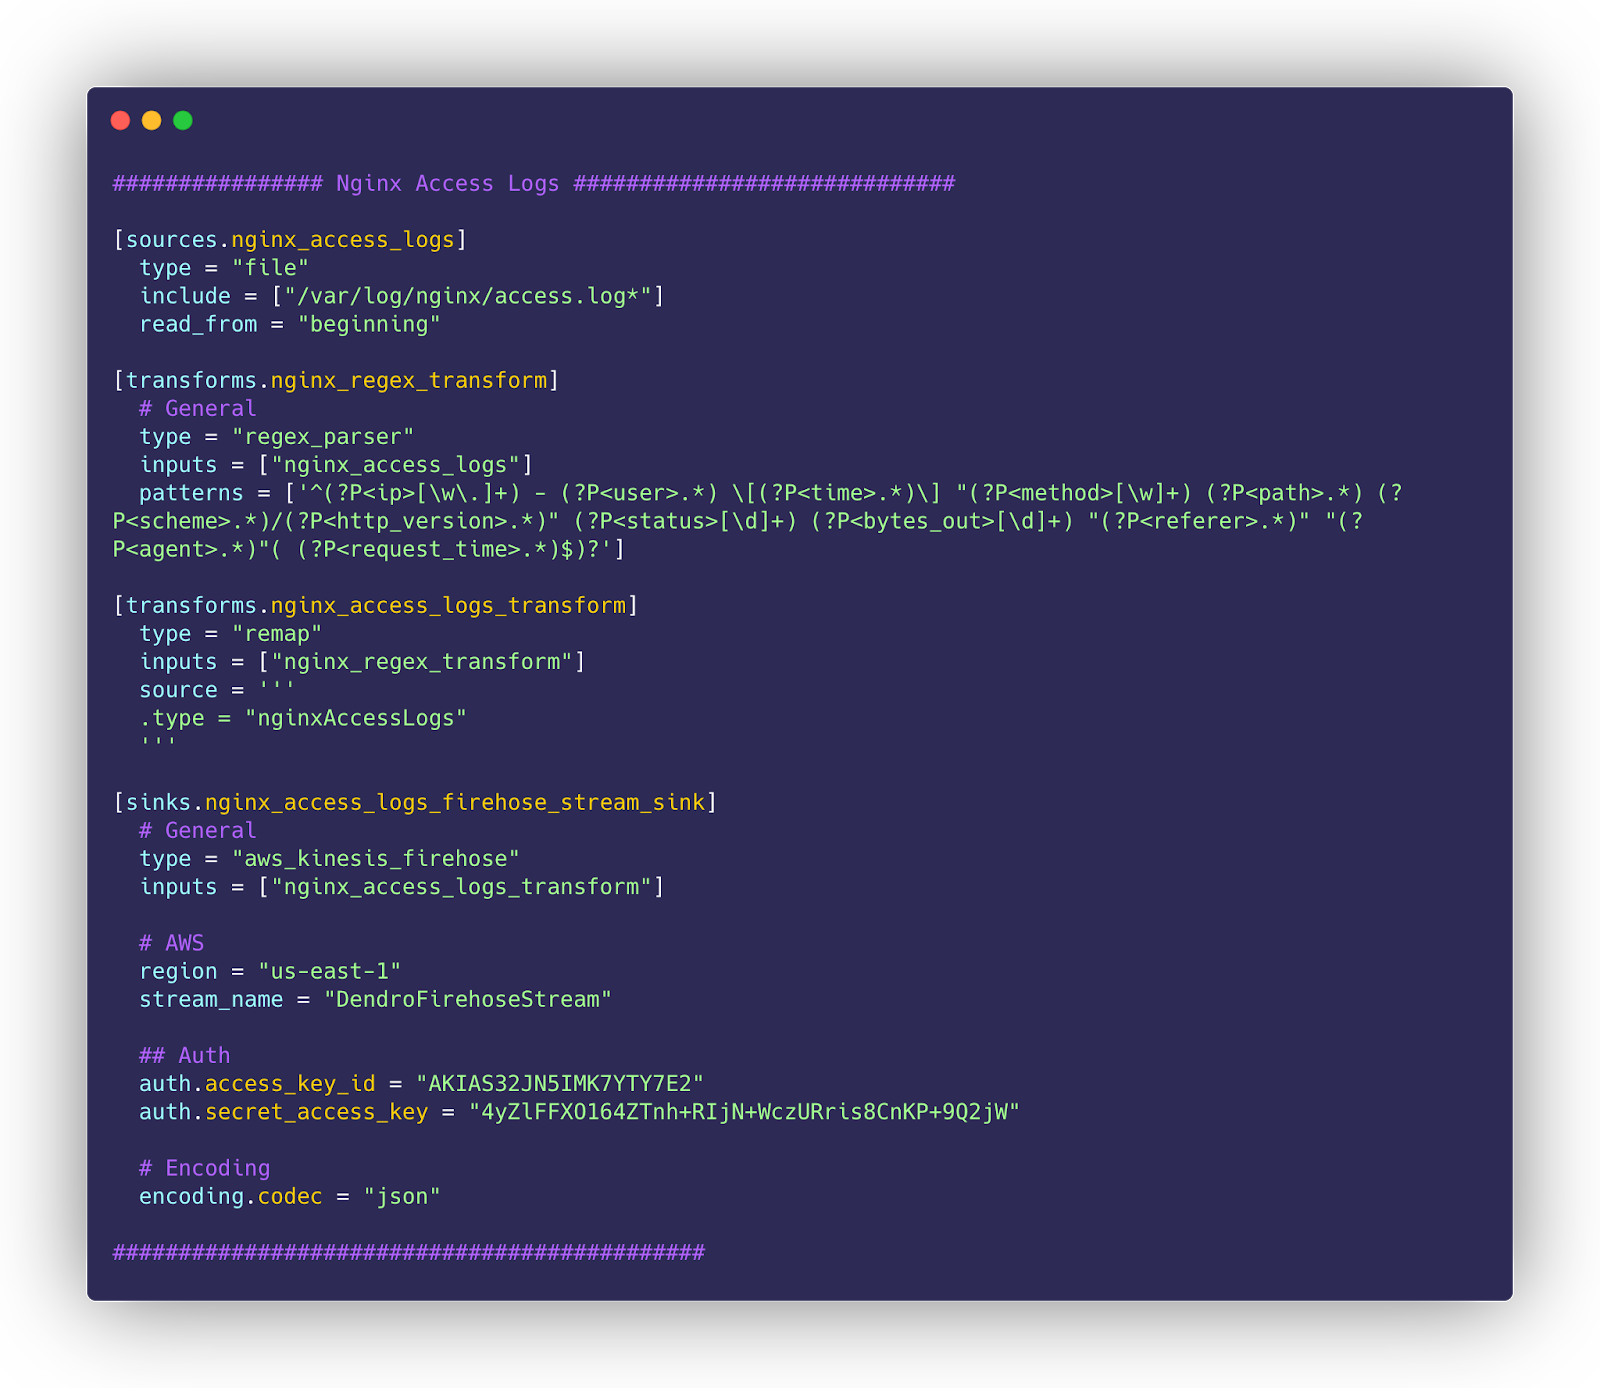
Writing out all of this information is extremely laborious. A fully fleshed out configuration file is over 400 lines long, and this caused our team plenty of headaches when we were first manually typing it out.
In order to streamline this, the team built a `dendro configure` CLI command that launches a configuration wizard, providing a prompt to select which services our users want to monitor. With these services selected, Dendro is able to dynamically generate the long config file Vector requires without manual effort.

Once Vector is properly configured, it gathers logs and metrics, transforms them from plaintext to JSON, and then sends them off to the cloud pipeline. Once in the pipeline, the first stop is AWS Kinesis Data Firehose.
5.2 Transform
Kinesis Data Firehose is a fully-managed, real-time streaming platform that captures, transforms & delivers data. It ingests new data up to a predefined threshold (Dendro defaults to use one minute/1MB) in order to optimize network efficiency, and because it’s completely serverless, it adds no additional infrastructure for the users of Dendro to manage.
In today’s distributed world, data produced by one service is often consumed by multiple other services. Connecting all of these is difficult, time-consuming and hyper-specific. Dendro uses Kinesis to help decouple services from one another. Instead of connecting every service together in a hyper-specific manner, each service can publish to or consume from the Data Firehose.
Once the data buffering threshold is met, data is pointed to the static HTTP Endpoint of an S3 bucket. Data is temporarily staged in the bucket for two main reasons: to assist with retries of failed deliveries and persist any records that errored out before being stored in Timestream (which will prompt an alert from Dendro’s monitoring setup, as we’ll discuss later), as well as to trigger a Lambda function on being written.
Lambda is a serverless compute service that allows users to execute code without provisioning servers. Lambdas can be invoked in response to certain triggers making them event-driven, and they can scale proportionally to the incoming workload by concurrently invoking more instances of a function when needed. This ability to continuously scale is perfect for Dendro because log data tends to be very bursty.
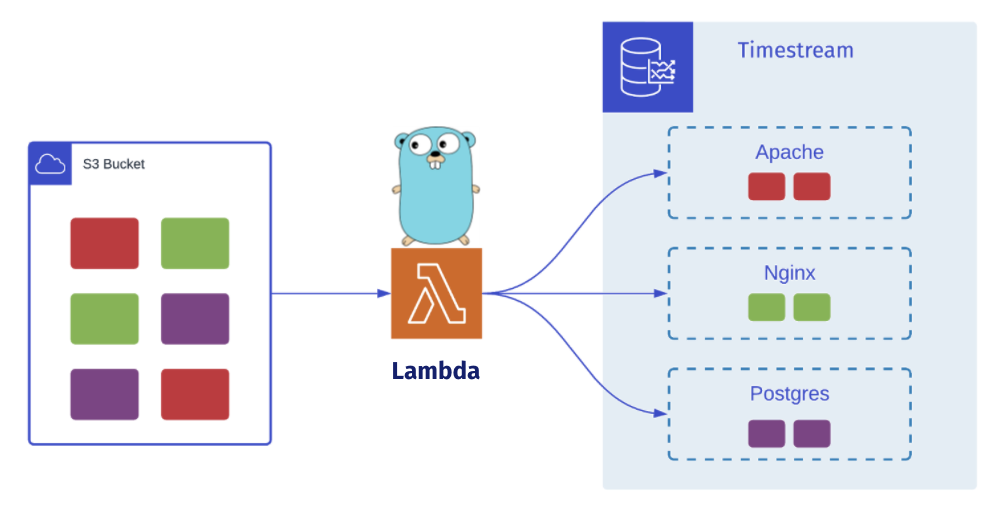
The Lambda function serves to transform, sort, and load data into Timestream, our selected time-series database. The team initially wrote the Lambda function in JavaScript, but later rewrote it in Golang because the Lambda function is pivotal to the throughput of data ingestion and using a compiled language offered faster speeds and lower overhead. This rewrite to Go netted us a two-fold increase in throughput when processing 1,000 records.
Once invoked, Dendro’s Lambda function retrieves the newly written records from the bucket, sorts, and stores them into separate tables in Timestream based on the type property, which is added earlier using Vector.
5.3 Store
This takes us to Timestream, a time-series optimized database service. With the user’s data extracted, transformed, and finally loaded into Timestream, they are able to analyze and query this data across arbitrary periods of time. Dendro has taken their raw logs and metrics and converted them into a form that's easily analyzable and processable.
This is possible because Timestream provides a SQL-like language to query this data. This query language is extremely powerful because not only is it already familiar to most developers, but also it adds some very powerful functions that work with time-series datasets.
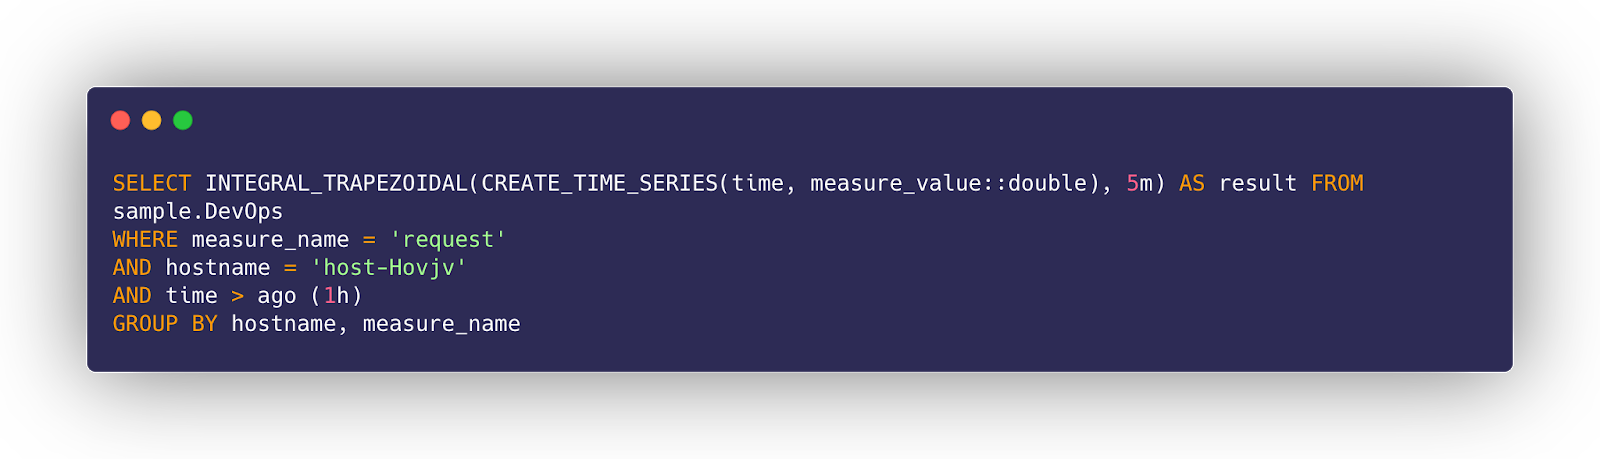
The power of a time-series database can be summed up by the idea that changes in data over time are tracked as INSERTS, rather than as UPDATES. There’s no rewriting of existing data when you’re thinking in terms of time-series, there are just multiple observations over time. This unlocks rich potential for graphing, visualizing, and understanding trends in your data over time-- precisely what the team set out to do when we designed Dendro.
5.4 Monitor
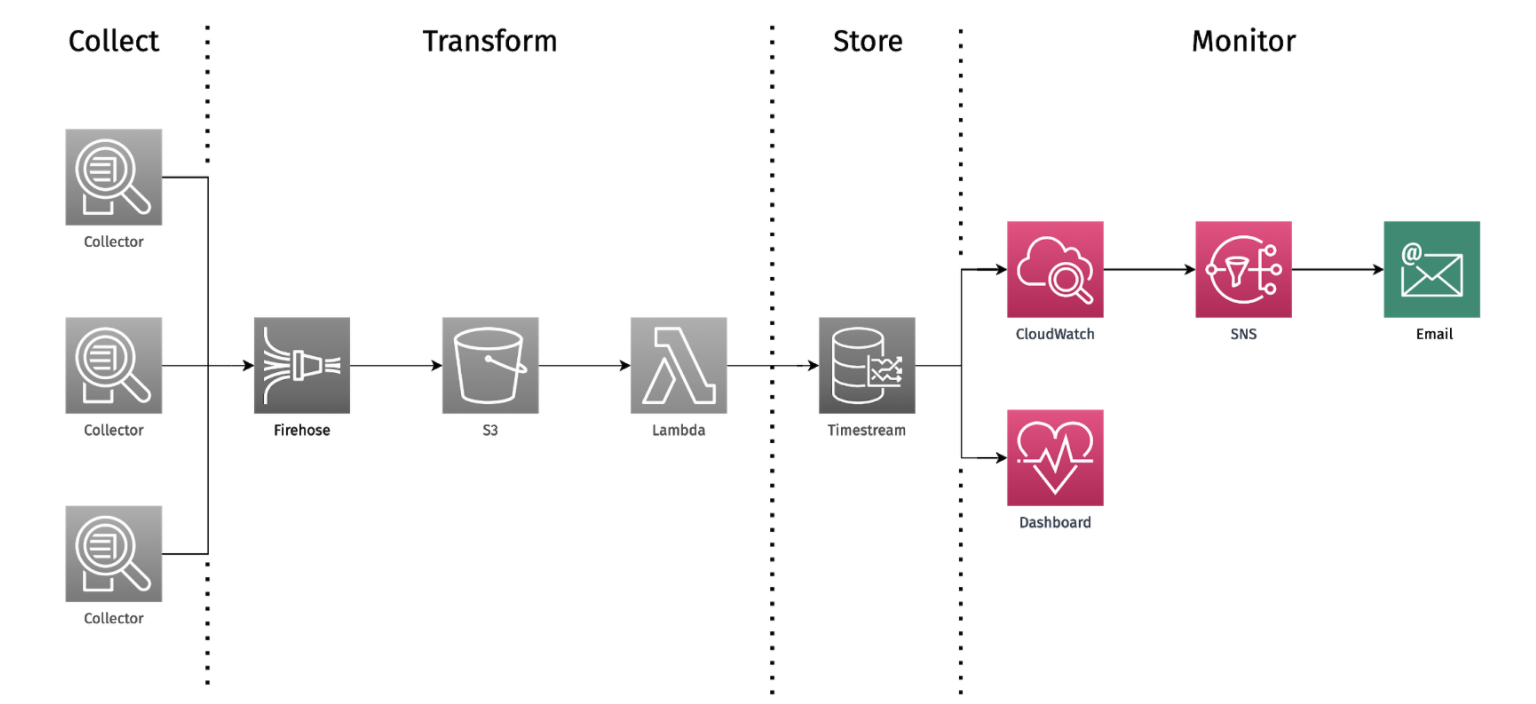
With the aforementioned infrastructure in place, the team was able to build a monitoring and alerting system to harness the incoming logs. This enables some useful functionality, like the ability to email our users as soon as critical errors in their distributed system occur (like a web server suddenly only returning 500 response codes). This core functionality is made possible by CloudWatch.
CloudWatch provides a centralized view of all the logs coming from the user’s cloud infrastructure. Dendro users are able to set up metric filters on incoming logs and set heuristic thresholds that, when activated, will set off an alarm. Triggered alarms publish an event to their corresponding Simple Notification Service topic, which will in turn email any users that have subscribed to that topic during setup. This allows us to watch for any errors as they occur and immediately notify our users.
Finally, we arrive at Dendro’s custom-built data exploration and dashboarding server.
We built a dashboarding hub to help users visualize and query their data in near real-time as it's being produced. This dashboard is available for view on any machine in the user’s distributed system that has Dendro installed. The team has pre-populated the dashboard with charts that allow users of Dendro to isolate anomalies and see historical trends. These charts are generated and populated in real time, providing an up-to-the-minute view of system state in a single location.
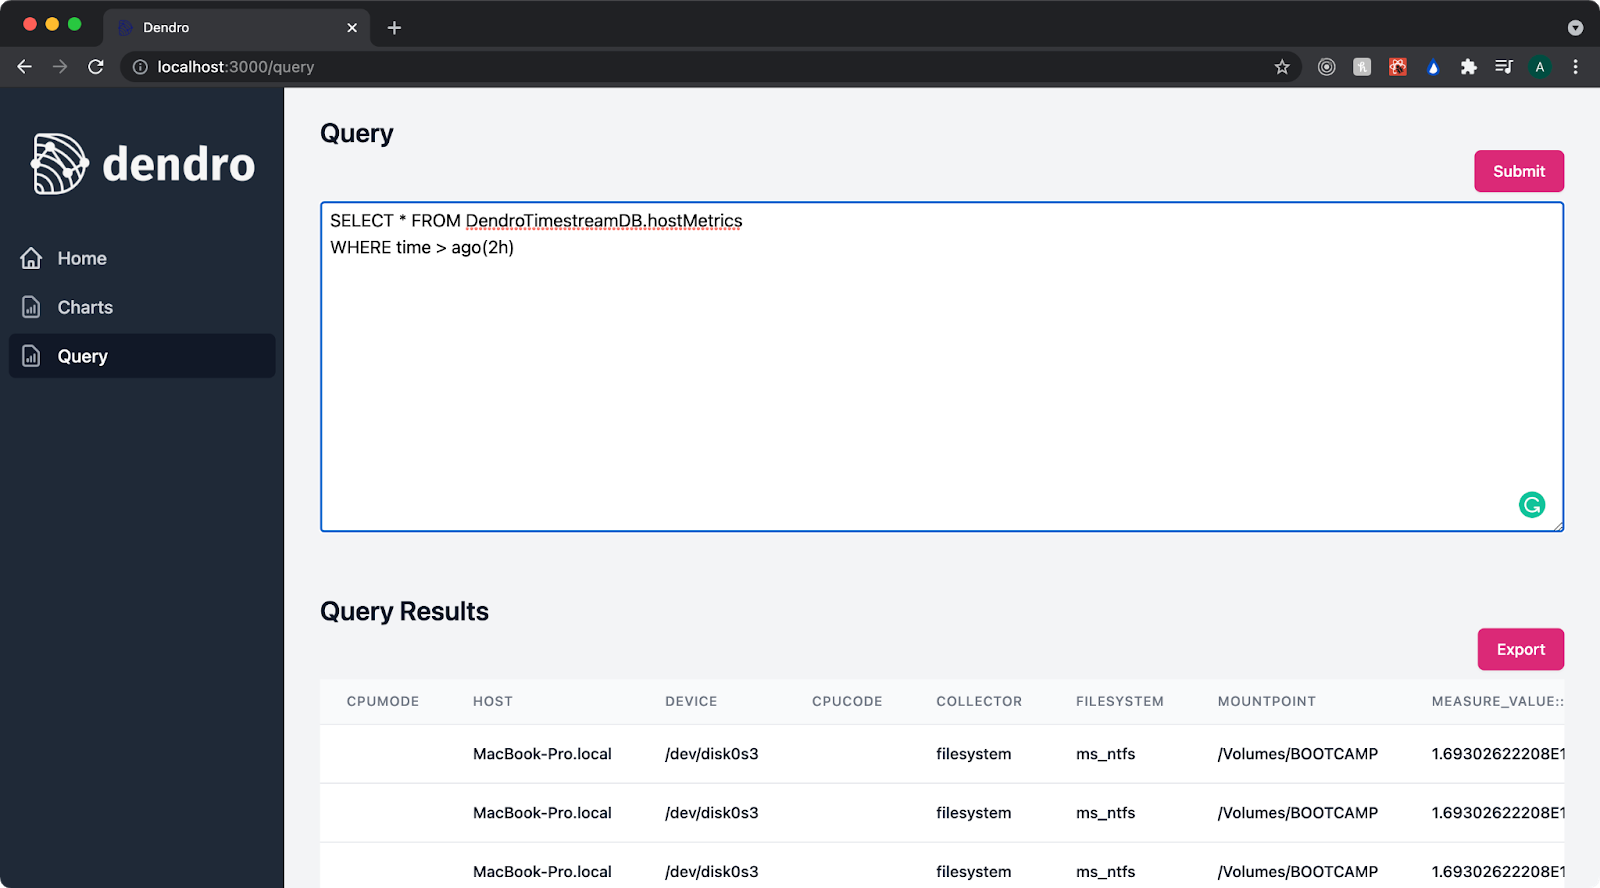
Because accessing AWS functionality through their actual website GUI can take time and effort, we also built in the ability to query Timestream directly from the dashboarding hub, exploring any returned rows for convenience and exporting the data as JSON with the click of a button.
Now that we’ve individually examined each component of Dendro, we’re better equipped to understand Dendro as a whole and how to use it.
6 Installing and Using Dendro
6.1 Installing Dendro
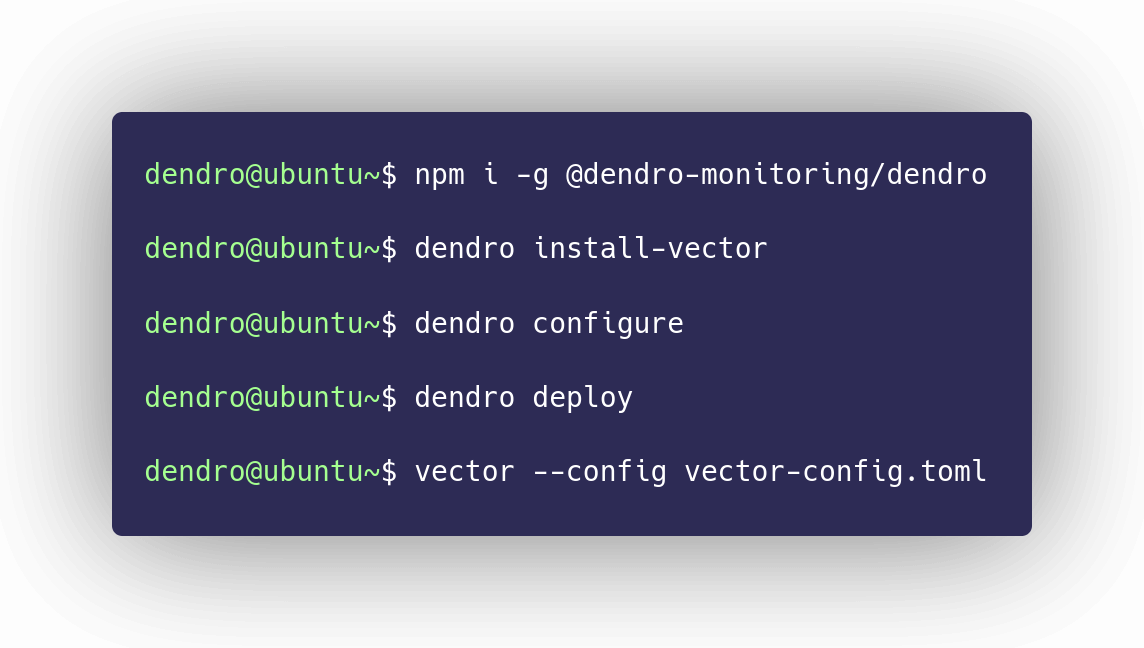
Dendro is an npm package, which means the first step is to download and install it just like any other npm
package. Make sure to use the -g flag so that the command is available throughout
your local environment.
The second step is to install the data collecting agent, Vector, on the local machine. Dendro provides a command which helps the user to install Vector given their particular package manager.
The third step is to configure Dendro for that server using the dendro configure
command. This step results in
two configuration files: 1. a file that Vector uses to monitor the selected services on that machine, 2. A
file that Dendro uses to deploy the pipeline, including AWS credentials and database tables that match the
selected services for that server.
Dendro now knows which services the user wants to monitor on their machine. The fourth step is to actually
build the
pipeline by running the command dendro deploy. Again, the pipeline provides a
centralized location where all
of the monitoring data from the user's various servers will live.
Running the dendro deploy command sets up the AWS infrastructure, including the IAM role, the Kinesis Firehose stream, the S3 bucket, the Lambda function, and the Timestream database with the correct tables.
It asks if the user’s AWS credentials have the appropriate permissions, providing a link where they can confirm that they do, then it asks if they want to set up alerting, which will send them an email under specific failure conditions.
The user can run the teardown command to remove all deployed AWS services. It will ask them to confirm that the user wants to delete the resources. The teardown command is for ease of use and to ensure that there are no extra AWS services floating around in the user’s account.
Now that the pipeline is set up, the user is ready to send data to it. They do this by running vector.
The user starts Vector by running the command vector --config vector-config.toml,
passing in the
configuration file generated from the configure command. This file ensures that they are monitoring the
appropriate services on this machine. Vector is now streaming logs and metrics to the AWS pipeline.
6.2 Using Dendro
Now that the user has data passing through to the database, they can visit the frontend, which is accessed by running the command dendro start:server from any computer that has dendro installed and configured, and then visiting localhost port 3000 on a browser.
There are three pages listed on the sidebar. A homepage, a charts page, and a query page. On the homepage, the user can see what services are being monitored and check that the pipeline is successfully writing records to the database.
On the charts page, the user sees real-time data for the services currently being monitored. This includes key metrics from the RED method, such as the rate of requests, the number of errors among those requests, and the duration of the requests.
The query page enables the user to query the Timestream database. In this example, they query the nginx access logs for all 500 errors that occurred in the last 2 hours. A user can also export the data and begin to drill down to find the source of the problem.
7 Implementation Challenges
We had to overcome 3 major technical challenges while building Dendro. AWS: the optimistic Response object Real-time data transformations What does Dendro visualize?
7.1 AWS: the optimistic Response object
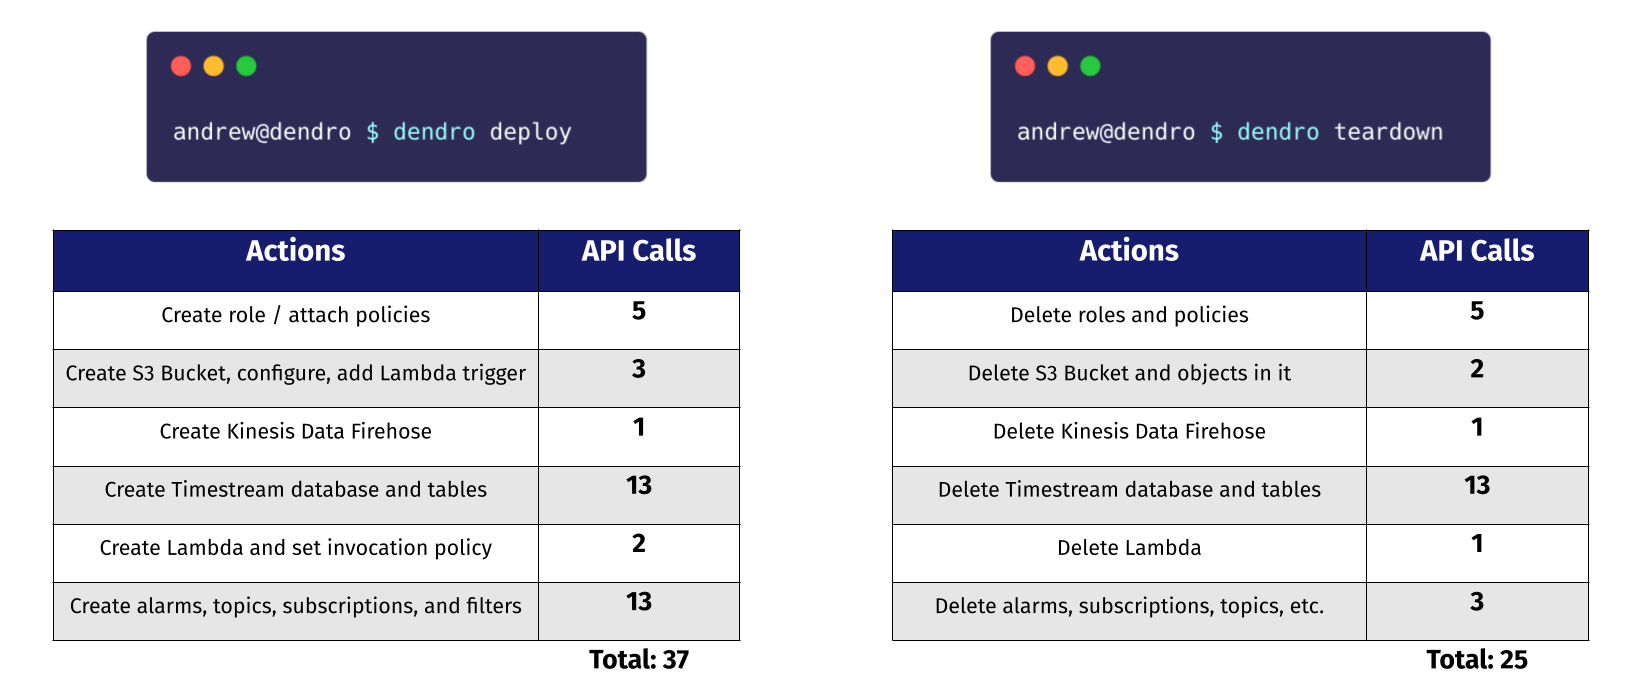
One major challenge the team faced while building the deploy and teardown commands
was related to spinning up or destroying AWS services that depend on the existence of another service in order
to successfully deploy or that cannot be destroyed while another service depends on it. deploy
fires off 37 API calls, while teardown executes 25.
deploy and teardown
commandsFor example, certain services couldn’t be spun up before the requisite IAM permissions were created or attached, or Timestream tables couldn’t be created until the database was successfully created.
When an HTTP request is dependent on a successful response to a previous one, you expect to be able to make the first request, wait to receive the response, and only then send the second request.
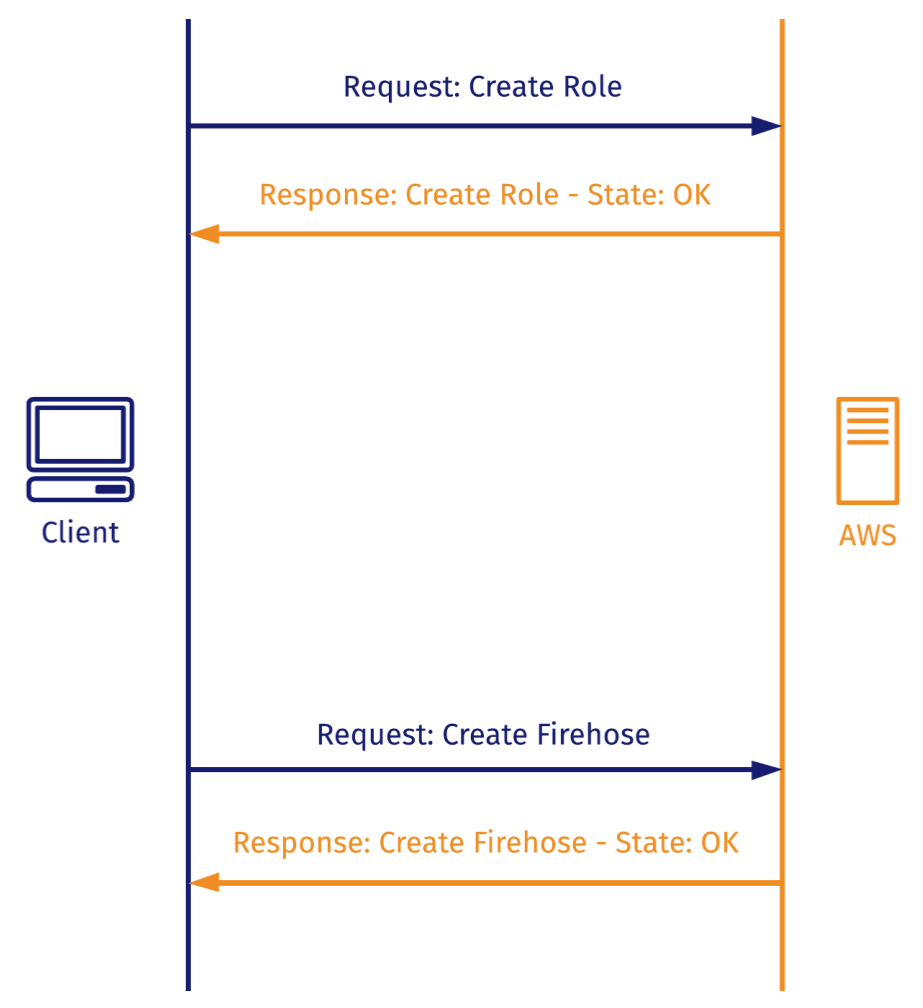
When using the AWS SDK, AWS returns an AWS Response object that doesn’t necessarily indicate that the service has been created! So when you predicate the next step on the receipt of the Response object and send the subsequent request, it often fails.
To overcome this, we implemented long polling AWS with exponential back off. Dendro asks Amazon repeatedly whether the operation has been completed, increasing the time between failed polls at an exponential rate in order to avoid overwhelming the server or hitting a rate limit. Once the AWS Response object returns a state that is not LOADING, Dendro can then react to that state change accordingly.
7.2 Transforming data in real-time
How does Dendro take raw, plain-text logs and prepare them for insertion to a time-series database? To achieve this, the team had to build in two separate data transformation steps throughout the pipeline. The first happens at the point of collection, while the second happens in the Lambda function triggered by Kinesis Data Firehose writing to the S3 bucket. We have already discussed how both work but to reiterate:
Logs are typically emitted as plain-text. During the log collection process, Dendro takes some steps to prepare it for insertion into the database. It first has to parse the record using a regex pattern written specifically to match this particular log format. Parsing that plain-text log with such a regex pattern gives us a structured JSON object. Dendro then injects a `type` key into the JSON object to note the record source and transport it off the host server.
The second data transformation happens in the Lambda function where Dendro takes an octet-stream, parses it, and then writes to the database.
Part of the appeal of the Kinesis Data Firehose is that it can accept data from any source: JSON, XML and numerous other formats. Firehose just accepts that data without checking or enforcing its validity. Unfortunately, the easiest way to accept any data is to convert it to binary and keep appending it to a binary blob. This is exactly what Firehose does and where it converts the JSON Dendro built while collecting records into an octet-stream.
We first start by converting the binary data into a string. This looks similar to an array of JSON records but is missing a few tokens (brackets, commas, etc.) making it unparsable/invalid JSON.
We can use regex to insert those missing tokens and then successfully parse the octet-stream back into JSON.
Once the record is parsable, Dendro checks that the type key that was injected during the first
data transformation phase. This key helps us identify the source of the record, what data to pluck out and
store and what table within Timestream to insert it in.
7.3 What to Visualize
When Naptime’s servers are down and they view the Dendro dashboard, what are the key metrics they need to see in order to resolve their outage? The challenge here wasn’t in writing SQL queries, but actually taking a step back and deciding how to represent what Dendro tracks and measures visually.
There are some main schools of thought on what metrics matter most for monitoring, named things like “The Four Golden Signals”, “USE”, and the “RED Method”. Tom Wilkie, a former site reliability engineer (SRE) at Google, created the microservice-oriented monitoring philosophy called RED. It focuses on rate, errors & duration, and the team found that it had the right balance of simplicity and specificity for our use-case, as well as that it was particularly well suited to time-series data. “Rate” refers to the number of requests per second a service is receiving. “Errors” is the number of the requests that receive an error response from the service. “Duration” is the length of time the service takes to complete a response to a request.
We found that RED matched our use case nicely, perhaps due to the fact that microservice architectures are typically distributed systems.
Tom Wilkie has written that “understanding the error rate, the request rate, and then some distribution of latency gives you a nice, consistent view of how your architecture is behaving.” That’s exactly what we wanted Dendro to provide: a consistent view of how your architecture is behaving over time.
8 Future Work
Of course, an open source project is never fully finished. While we think Dendro is currently feature-complete, ready for people to use and immediately benefit from, there are certain future work items that would strengthen the overall framework.
- We would like to provide our users the ability to inject more and more varied custom transforms into the pipeline. It’s possible as of now if they go and edit the configuration files, but that’s manual and Dendro is all about reducing toil.
- We’d also like to provide built-in support for MySQL, which Vector does not currently support as a native source but which they do plan to build as part of a future milestone.
- And finally, on the dashboard, we would like to provide syntax highlighting for SQL queries as well as more out of the box graphs and visualizations.
9 Team